What Sparked Your Interest In Science?
What sparked your interest in science?
More Posts from Nasa and Others
What is your favorite sci-fi show about space?
I actually wasn’t a huge sci-fi person growing up, but of course I am a fan of Star Wars. After graduate school I stumbled upon Battlestar Galactica (the new one) and was definitely hooked, especially since I was living in Vancouver at the time and it was filmed there!
Uncovering a Massive Meteor Crater Found Lurking Under the Ice

For the first time ever, we've found a massive crater hiding under one of Earth's ice sheets. Likely caused by a meteor, it was uncovered in Greenland by a team of international scientists using radar data.

The data was collected by missions like our Operation IceBridge, which flies planes over Greenland and Antarctica to study the ice and snow at our planet’s poles.

In this case, the crater is near Hiawatha Glacier, covered by a sheet of ice more than half a mile thick. We're pretty sure that the crater was caused by a meteor because it has characteristics traditionally associated with those kinds of impacts, like a bowl shape and central peaks.

It’s also one of the 25 largest impact craters in the world, large enough to hold the cities of Paris or Washington, D.C. The meteor that created it was likely half a mile wide.

Currently, there’s still lots to learn about the crater – and the meteor that created it – but it’s likely relatively young in geologic timescales. The meteor hit Earth within the last 3 million years, but the impact could have been as recent as 13,000 years ago.

While it was likely smaller than the meteor credited with knocking out the dinosaurs, this impact could have potentially caused a large influx of fresh water into the northern Atlantic Ocean, which would have had profound impacts for life in the region at the time.

Go here to learn more about this discovery: https://www.nasa.gov/press-release/international-team-nasa-make-unexpected-discovery-under-greenland-ice

Operation IceBridge continues to uncover the hidden secrets under Earth's ice. IceBridge has been flying for 10 years, providing a data bridge between ICESat, which flew from 2003 to 2009, and ICESat-2, which launched in September. IceBridge uses a suite of instruments to help track the changing height and thickness of the ice and the snow cover above it. IceBridge also measures the bedrock below the ice, which allows for discoveries like this crater.
Make sure to follow us on Tumblr for your regular dose of space: http://nasa.tumblr.com
Celebrating 81 Years of Ingenuity

Eighty-one years ago, our world-class research center in California’s Silicon Valley was born. Ground broke on Ames Research Center on Dec. 20, 1939. It was the second aeronautical laboratory established by the National Advisory Committee for Aeronautics to perform fundamental research on all things flight. From its very beginnings, Ames was a place for innovation. Tests performed in its wind tunnels transformed military aircraft during World War II and paved the way for air travel at supersonic speeds. In the 1950s and ‘60s, its researchers looked to the stars and came up with new designs and materials for spacecraft that would make human spaceflight a reality. Fast-forward to the present, and the center contributes to virtually every major agency mission through its expertise in spacecraft entry systems, robotics, aeronautics, supercomputing, and so much more! Here are things to know about Ames.
Ames Research Center is home to the world’s largest wind tunnel.

The center is also home to Pleiades, our most powerful supercomputer.

Its modeling and simulation work plays a key role in designing new vehicles for exploring space.

The center invented heat shield materials for landing rovers on Mars.

It built robots to assist astronauts living and working aboard the International Space Station.

It launched a space telescope that revealed thousands of worlds beyond our solar system.

The center has also led multiple missions to explore the Moon.

It found water on the Moon ... more than once, and in places no one would have guessed.

The Volatiles Investigating Polar Exploration Rover is the latest lunar exploration mission led by Ames. Launching in 2023, the mobile robot will search for water ice inside craters and other places at the Moon's South Pole. Its survey will help pave the way for astronaut missions to the lunar surface beginning in 2024 as part of the Artemis program.
Make sure to follow us on Tumblr for your regular dose of space: http://nasa.tumblr.com.
How to See Comet NEOWISE
Observers all over the world are hoping to catch a glimpse of Comet NEOWISE before it speeds away into the depths of space, not to be seen again for another 6,800 years.
For those that are, or will be, tracking Comet NEOWISE there will be a few particularly interesting observing opportunities this week.

Over the coming days it will become increasingly visible shortly after sunset in the northwest sky.

The object is best viewed using binoculars or a small telescope, but if conditions are optimal, you may be able to see it with the naked eye. If you’re looking in the sky without the help of observation tools, Comet NEOWISE will likely look like a fuzzy star with a bit of a tail. Using binoculars will give viewers a good look at the fuzzy comet and its long, streaky tail.
Here’s what to do:
Find a spot away from city lights with an unobstructed view of the sky
Just after sunset, look below the Big Dipper in the northwest sky
Each night, the comet will continue rising increasingly higher above the northwestern horizon.

There will be a special bonus for viewers observing comet NEOWISE from the northeast United States near Washington, DC. For several evenings, there will be a brief conjunction as the International Space Station will appear to fly near the comet in the northeast sky. Approximate times and locations of the conjunctions are listed below (the exact time of the conjunction and viewing direction will vary slightly based on where you are in the Washington, DC area):
July 17 : ~10:56 p.m. EDT = NEOWISE elevation: ~08° Space Station elevation: ~14°
July 18 : ~10:08 p.m. EDT = NEOWISE elevation: ~13° Space Station elevation: ~18°
July 19 : ~10:57 p.m. EDT = NEOWISE elevation: ~10° Space Station elevation: ~08°
July 20 : ~10:09 p.m. EDT = NEOWISE elevation: ~17° Space Station elevation: ~07°
It will be a late waning Moon, with the New Moon on July 20, so the viewing conditions should be good as long as the weather cooperates.
Comet NEOWISE is about 3 miles across and covered in soot left over from its formation near the birth of our solar system 4.6 billion years ago - a typical comet.

Comets are frozen leftovers from the formation of the solar system composed of dust, rock and ices. They range from a few miles to tens of miles wide, but as they orbit closer to the sun, they heat up and spew gases and dust into a glowing head that can be larger than a planet. This material forms a tail that stretches millions of miles.
Make sure to follow us on Tumblr for your regular dose of space: http://nasa.tumblr.com
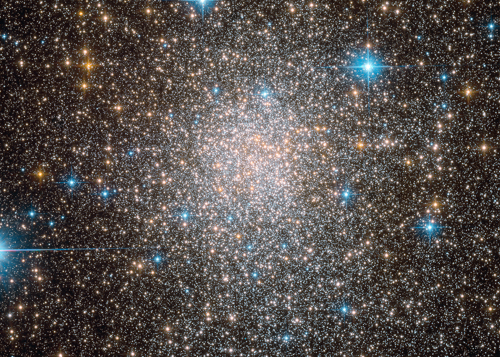
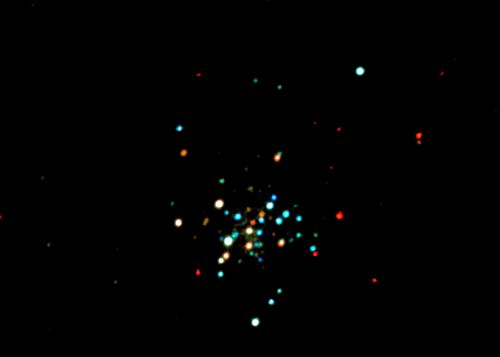
Even star systems have identity crises. 🤷 According to data from observatories like our @nasachandraxray, a double star system has been rapidly flipping between two alter egos: a low-mass X-ray binary and a millisecond pulsar. Astronomers found this volatile double system in a dense collection of stars known as Terzan 5. The first image from @NASAHubble shows Terzan 5 in optical light. Swipe to see the new image where low, medium and high-energy X-rays detected by Chandra are colored red, green and blue respectively. Click the link in bio for more.
Make sure to follow us on Tumblr for your regular dose of space: http://nasa.tumblr.com

For Earth Day, we’re inviting you to take a moment to celebrate our wonderful water world, Earth. As far as we know, our Blue Marble is the only place in the universe with life, and that life depends on water. Snap a photo of yourself outside and tag it #GlobalSelfie – bonus points if your selfie features your favorite body of water! http://go.nasa.gov/3xFt0H0
Make sure to follow us on Tumblr for your regular dose of space!
Celebrating 17 Years of NASA’s ‘Little Earth Satellite That Could’
The satellite was little— the size of a small refrigerator; it was only supposed to last one year and constructed and operated on a shoestring budget — yet it persisted.
After 17 years of operation, more than 1,500 research papers generated and 180,000 images captured, one of NASA’s pathfinder Earth satellites for testing new satellite technologies and concepts comes to an end on March 30, 2017. The Earth Observing-1 (EO-1) satellite will be powered off on that date but will not enter Earth’s atmosphere until 2056.
“The Earth Observing-1 satellite is like The Little Engine That Could,” said Betsy Middleton, project scientist for the satellite at NASA’s Goddard Space Flight Center in Greenbelt, Maryland.
To celebrate the mission, we’re highlighting some of EO-1’s notable contributions to scientific research, spaceflight advancements and society.
Scientists Learn More About Earth in Fine Detail

This animation shifts between an image showing flooding that occurred at the Arkansas and Mississippi rivers on January 12, 2016, captured by ALI and the rivers at normal levels on February 14, 2015 taken by the Operational Land Imager on Landsat 8. Credit: NASA’s Earth Observatory
EO-1 carried the Advanced Land Imager that improved observations of forest cover, crops, coastal waters and small particles in the air known as aerosols. These improvements allowed researchers to identify smaller features on a local scale such as floods and landslides, which were especially useful for disaster support.

On the night of Sept. 6, 2014, EO-1’s Hyperion observed the ongoing eruption at Holuhraun, Iceland as shown in the above image. Partially covered by clouds, this scene shows the extent of the lava flows that had been erupting.
EO-1’s other key instrument Hyperion provided an even greater level of detail in measuring the chemical constituents of Earth’s surface— akin to going from a black and white television of the 1940s to the high-definition color televisions of today. Hyperion’s level of sophistication doesn’t just show that plants are present, but can actually differentiate between corn, sorghum and many other species and ecosystems. Scientists and forest managers used these data, for instance, to explore remote terrain or to take stock of smoke and other chemical constituents during volcanic eruptions, and how they change through time.
Crowdsourced Satellite Images of Disasters

EO-1 was one of the first satellites to capture the scene after the World Trade Center attacks (pictured above) and the flooding in New Orleans after Hurricane Katrina. EO-1 also observed the toxic sludge in western Hungary in October 2010 and a large methane leak in southern California in October 2015. All of these scenes, which EO-1 provided quick, high-quality satellite imagery of the event, were covered in major news outlets. All of these scenes were also captured because of user requests. EO-1 had the capability of being user-driven, meaning the public could submit a request to the team for where they wanted the satellite to gather data along its fixed orbits.

This image shows toxic sludge (red-orange streak) running west from an aluminum oxide plant in western Hungary after a wall broke allowing the sludge to spill from the factory on October 4, 2010. This image was taken by EO-1’s Advanced Land Imager on October 9, 2010. Credit: NASA’s Earth Observatory
Artificial Intelligence Enables More Efficient Satellite Collaboration

This image of volcanic activity on Antarctica’s Mount Erebus on May 7, 2004 was taken by EO-1’s Advanced Land Imager after sensing thermal emissions from the volcano. The satellite gave itself new orders to take another image several hours later. Credit: Earth Observatory
EO-1 was among the first satellites to be programmed with a form of artificial intelligence software, allowing the satellite to make decisions based on the data it collects. For instance, if a scientist commanded EO-1 to take a picture of an erupting volcano, the software could decide to automatically take a follow-up image the next time it passed overhead. The Autonomous Sciencecraft Experiment software was developed by NASA’s Jet Propulsion Laboratory in Pasadena, California, and was uploaded to EO-1 three years after it launched.

This image of Nassau Bahamas was taken by EO-1’s Advanced Land Imager on Oct 8, 2016, shortly after Hurricane Matthew hit. European, Japanese, Canadian, and Italian Space Agency members of the international coalition Committee on Earth Observation Satellites used their respective satellites to take images over the Caribbean islands and the U.S. Southeast coastline during Hurricane Matthew. Images were used to make flood maps in response to requests from disaster management agencies in Haiti, Dominican Republic, St. Martin, Bahamas, and the U.S. Federal Emergency Management Agency.
The artificial intelligence software also allows a group of satellites and ground sensors to communicate and coordinate with one another with no manual prompting. Called a "sensor web", if a satellite viewed an interesting scene, it could alert other satellites on the network to collect data during their passes over the same area. Together, they more quickly observe and downlink data from the scene than waiting for human orders. NASA's SensorWeb software reduces the wait time for data from weeks to days or hours, which is especially helpful for emergency responders.
Laying the Foundation for ‘Formation Flying’

This animation shows the Rodeo-Chediski fire on July 7, 2002, that were taken one minute apart by Landsat 7 (burned areas in red) and EO-1 (burned areas in purple). This precision formation flying allowed EO-1 to directly compare the data and performance from its land imager and the Landsat 7 ETM+. EO-1’s most important technology goal was to test ALI for future Landsat satellites, which was accomplished on Landsat 8. Credit: NASA’s Goddard Space Flight Center
EO-1 was a pioneer in precision “formation flying” that kept it orbiting Earth exactly one minute behind the Landsat 7 satellite, already in orbit. Before EO-1, no satellite had flown that close to another satellite in the same orbit. EO-1 used formation flying to do a side-by-side comparison of its onboard ALI with Landsat 7’s operational imager to compare the products from the two imagers. Today, many satellites that measure different characteristics of Earth, including the five satellites in NASA's A Train, are positioned within seconds to minutes of one another to make observations on the surface near-simultaneously.
For more information on EO-1’s major accomplishments, visit: https://www.nasa.gov/feature/goddard/2017/celebrating-17-years-of-nasa-s-little-earth-satellite-that-could
Make sure to follow us on Tumblr for your regular dose of space: http://nasa.tumblr.com/.
Happy 50th Anniversary of Earth Day! 💙🌍
We’re so glad you could join us for this special Earth edition of Tumblr Answer Time. Today is a perfect day to learn about our home planet directly from the people who work to keep it safe.
Kick off starts NOW!
Our Acting Director of Earth Sciences, Sandra Cauffman, and Associate Administrator for the Science Mission Directorate, Dr. Thomas Zurbuchen have answers to your questions from their homes! Enjoy.
Make sure to follow us on Tumblr for your regular dose of space: http://nasa.tumblr.com.
Are We Alone? How NASA Is Trying to Answer This Question.
One of the greatest mysteries that life on Earth holds is, “Are we alone?”

At NASA, we are working hard to answer this question. We’re scouring the universe, hunting down planets that could potentially support life. Thanks to ground-based and space-based telescopes, including Kepler and TESS, we’ve found more than 4,000 planets outside our solar system, which are called exoplanets. Our search for new planets is ongoing — but we’re also trying to identify which of the 4,000 already discovered could be habitable.

Unfortunately, we can’t see any of these planets up close. The closest exoplanet to our solar system orbits the closest star to Earth, Proxima Centauri, which is just over 4 light years away. With today’s technology, it would take a spacecraft 75,000 years to reach this planet, known as Proxima Centauri b.
How do we investigate a planet that we can’t see in detail and can’t get to? How do we figure out if it could support life?
This is where computer models come into play. First we take the information that we DO know about a far-off planet: its size, mass and distance from its star. Scientists can infer these things by watching the light from a star dip as a planet crosses in front of it, or by measuring the gravitational tugging on a star as a planet circles it.
We put these scant physical details into equations that comprise up to a million lines of computer code. The code instructs our Discover supercomputer to use our rules of nature to simulate global climate systems. Discover is made of thousands of computers packed in racks the size of vending machines that hum in a deafening chorus of data crunching. Day and night, they spit out 7 quadrillion calculations per second — and from those calculations, we paint a picture of an alien world.

While modeling work can’t tell us if any exoplanet is habitable or not, it can tell us whether a planet is in the range of candidates to follow up with more intensive observations.

One major goal of simulating climates is to identify the most promising planets to turn to with future technology, like the James Webb Space Telescope, so that scientists can use limited and expensive telescope time most efficiently.

Additionally, these simulations are helping scientists create a catalog of potential chemical signatures that they might detect in the atmospheres of distant worlds. Having such a database to draw from will help them quickly determine the type of planet they’re looking at and decide whether to keep observing or turn their telescopes elsewhere.
Learn more about exoplanet exploration, here.
Make sure to follow us on Tumblr for your regular dose of space: http://nasa.tumblr.com.
What are CubeSats?
CubeSats are a class of research spacecraft called nanosatellites. They provide low-cost opportunities for small satellite payloads to fly on rockets planned for upcoming launches. Small satellites, including CubeSats, are playing an increasingly larger role in exploration, technology demonstration, scientific research and educational investigations here at NASA.

Fourteen miniature satellites were deployed from the International Space Station earlier this week. Two of the CubeSats were Danish and have communication and ship signal tracking capabilities. The remaining are Dove satellites from Planet Labs and will take images of Earth from space.
On Thursday, Oct. 8, thirteen CubeSats are scheduled to launch aboard a United Launch Alliance Atlas V rocket at 8:49 a.m. EDT. Watch live on NASA TV starting at 8:29 a.m. http://www.nasa.gov/nasatv
To learn more about tomorrow’s launch, watch NASA Television today, Oct. 7 at 1 p.m. and 2 p.m. EDT. The briefings will highlight the growing importance of CubeSats in space exploration.
Make sure to follow us on Tumblr for your regular dose of space: http://nasa.tumblr.com
-
 orion-mp5 liked this · 3 years ago
 -
 lakelass liked this · 3 years ago
 -
 mrclaw61 liked this · 3 years ago
 -
 sasukikatoro liked this · 3 years ago
 -
rodblack2070 liked this · 3 years ago
-
 mymarcolelis liked this · 3 years ago
 -
 october---sky liked this · 3 years ago
 -
 infinitesystems liked this · 3 years ago
 -
 kolotushin liked this · 3 years ago
 -
 shelly-bee-world liked this · 3 years ago
 -
 belindasvasconcelos liked this · 3 years ago
 -
 littlemissrand liked this · 3 years ago
 -
 iyycecream liked this · 3 years ago
 -
 silentninjacat2 liked this · 3 years ago
 -
 dragons-barb liked this · 3 years ago
 -
 thefuckingbart liked this · 3 years ago
 -
 thewickedshadowhunterpigeon liked this · 3 years ago
 -
 mserihico liked this · 3 years ago
 -
 ringo6143 liked this · 3 years ago
 -
 ehsunassadi liked this · 3 years ago
 -
 random-acts-of-stupidity liked this · 3 years ago
 -
 sublimetrashprincess-blog liked this · 3 years ago
 -
 methylphenidate-moth liked this · 3 years ago
 -
 eagleyes37 liked this · 3 years ago
 -
artmazdragon liked this · 3 years ago
-
 taliarose17 liked this · 3 years ago
 -
 badinchannel liked this · 3 years ago
 -
 marelcu liked this · 3 years ago
 -
 the-final-disciple liked this · 3 years ago
 -
 alazarinmobius liked this · 3 years ago
 -
 mindlesrambling liked this · 3 years ago
 -
 biasedbodilybeing liked this · 3 years ago
 -
 jgoonet liked this · 3 years ago
 -
 go-redgirl liked this · 3 years ago
 -
 zerdax liked this · 3 years ago
 -
 perditorian liked this · 3 years ago
 -
 1-2-3-sunshine liked this · 3 years ago
 -
 sally--yoon liked this · 3 years ago
 -
 craig-marsh87 liked this · 3 years ago
 -
 rosaliachristian liked this · 3 years ago
Explore the universe and discover our home planet with the official NASA Tumblr account
1K posts